Trong bài viết này, các bạn hãy cùng IZONE phân tích cách viết của giảng viên IZONE và hoàn thiện bài writing task 1 sau đây nhé!
Đề bài: The first graph shows the number of train passengers from 2000 to 2009; the second compares the percentage of trains running on time and target in the period.
A. Translation (Dịch)
Trước khi đi sâu vào phân tích cấu trúc bài Ielts Writing Task 1 trên, các bạn hãy làm bài dịch sau để có thể củng cố thêm từ vựng và ngữ pháp khi gặp đề writing này nhé.
(Nhấn vào đây để xem hướng dẫn)
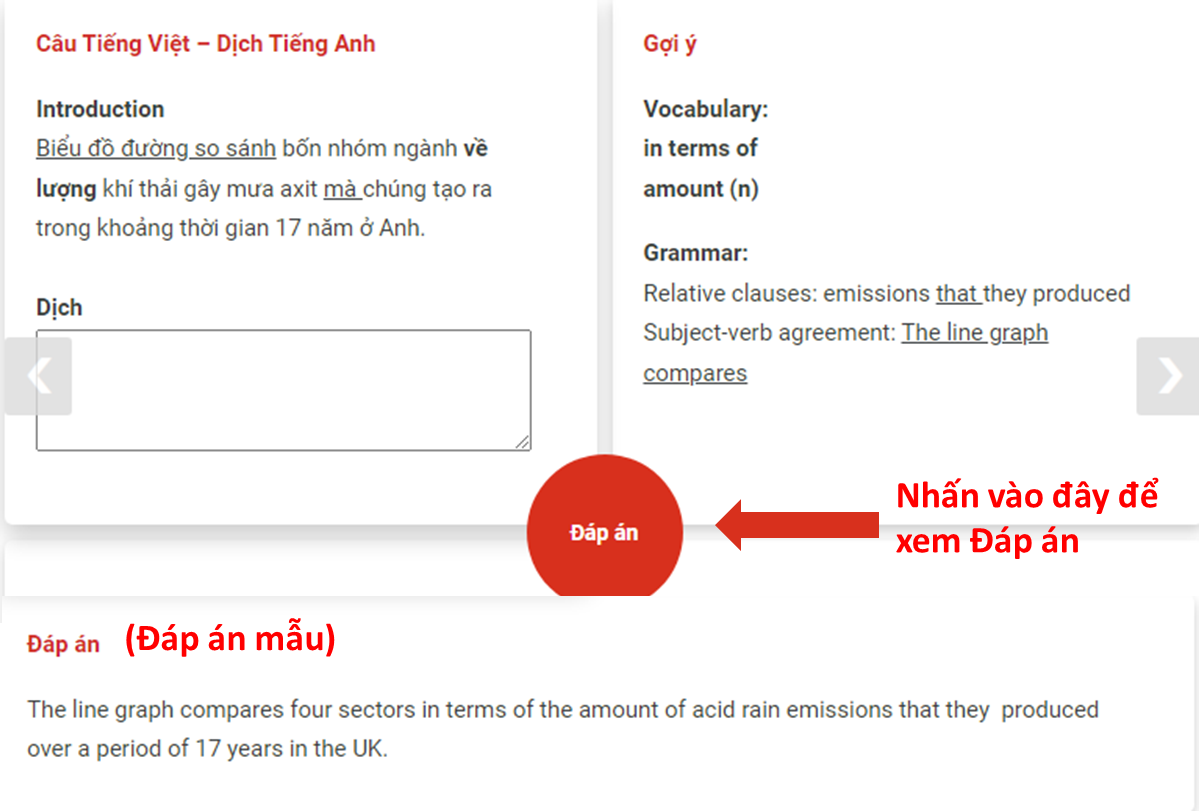
Introduction
Biểu đồ đường đầu tiên minh họa số liệu về người sử dụng đường sắt từ năm 2000 đến năm 2009.
Dịch
Vocabulary:
illustrate (v)
figure (n)
Grammar:
S-V agreement: The first line graph illustrates
The first line graph illustrates the figures for rail users between 2000 and 2009.
Biểu đồ thứ hai cho thấy tỷ lệ phần trăm các chuyến tàu đúng giờ so với mục tiêu trong cùng thời kỳ.
Dịch
Vocabulary:
punctual (adj)
target (n)
Grammar:
Relative clause (Dạng rút gọn chủ động): … being …
The second graph shows the percentage of trains being punctual in comparison with the target over the same period.
Overview
Rõ ràng là các số liệu trong cả hai biểu đồ đều dao động trong khoảng thời gian chín năm.
Dịch
Vocabulary:
fluctuate (v)
Grammar:
Dummy subject: It is adj that …
It is clear that the figures in both graphs fluctuated over the nine-year period.
Số hành khách đạt đỉnh vào thời kỳ giữa (2004 2005), trong khi tỷ lệ các chuyến tàu đúng giờ đạt đỉnh vào cuối thời kỳ được đo lường.
Dịch
Vocabulary:
Ridership (n)
reach its peak
Grammar:
Linking word: …, while …
Ridership peaked at the mid-period (2004 2005), while the percentage of punctual trains reached its peak towards the end of the period measured.
Body Paragraph 1
Số lượng người đi tàu bắt đầu ở mức 36 triệu người vào năm 2000.
Dịch
Vocabulary:
The number of N (plural)
start at
Grammar:
Relative clause (Dạng rút gọn chủ động): … riding …
The number of people riding the train started at 36 million in 2000.
Trong khoảng thời gian 5 năm tiếp theo, có một sự tăng lên tổng thể/nhìn chung trong số lượng hành khách đi tàu , mặc dù có sự sụt giảm trong giai đoạn 2002-2003.
Dịch
Vocabulary:
passenger (n)
dip (n)
Grammar:
There was …
Linking word: …, despite …
Over the next five-year period, there was an overall increase in the figures for train passengers, despite a dip between 2002 and 2003.
Số lượng hành khách đạt đỉnh khoảng 47 triệu người vào năm 2005, sau đó giảm dần cho đến năm 2008.
Dịch
Vocabulary:
peak at
decline gradually
Grammar:
Linking word: …, then …
Simple past tense: The ridership peaked
The ridership peaked at around 47 million in 2005, then declined gradually until 2008.
Từ năm 2008 đến cuối giai đoạn được hiển thị, con số này đã tăng khoảng 1 triệu.
Dịch
Vocabulary:
roughly
Grammar:
Relative clause (Dạng rút gọn bị động): … shown …
Rise by … : tăng bao nhiêu
From 2008 to the end of the period shown, the figure rose by roughly 1 million.
Body paragraph 2
Mục tiêu về tỷ lệ chuyến tàu đúng giờ là 95% không đổi trong suốt thời kỳ.
Dịch
Vocabulary:
punctuality (n)
constant (adj)
Grammar:
S-V agreement: The target …. was
The target for the percentage of train punctuality was a constant 95% throughout the period.
Vào năm 2000, con số thực tế là thấp hơn 3%.
Dịch
Vocabulary:
actual (adj)
short (adv)
Grammar:
S-V agreement: the actual figure was
In the year 2000, the actual figure was 3% short.
Nó đã tăng để đạt được mục tiêu vào năm 2002, trước khi tăng đều đặn và dần dần lên 96% trong 2 năm tiếp theo.
Dịch
Vocabulary:
pick up
steady (adj)
Grammar:
Linking word: … before …
It picked up to meet the target in 2002, before taking a steady and gradual rise to 96% in the next 2 years.
Tuy nhiên, con số này đã giảm mạnh 4% từ năm 2004 đến năm 2006 để bằng với con số ban đầu của năm 2000.
Dịch
Vocabulary:
sharp dive
the same as
Grammar:
Linking word: However, …
However, the figure took a sharp dive of 4% from 2004 to 2006 to be the same as the original 2000 figure.
Từ năm 2006 đến năm 2008, có sự tăng mạnh trong tỷ lệ các chuyến tàu đúng giờ, đạt mức cao nhất là 97%, trước khi chững lại vào năm cuối cùng của giai đoạn này.
Dịch
Vocabulary:
surge (n)
Level off
Grammar:
There was …
Linking word: Before …
From 2006 to 2008, there was a surge in the proportion of punctual trains to reach its peak of 97%, before levelling off in the last year of the period
Để xem bài dịch hoàn thiện các bạn hãy nhấn vào đây nhé!
Introduction
The first picture shows the layout of an art gallery, and the second shows some The first line graph illustrates the figures for rail users between 2000 and 2009. The second graph shows the percentage of trains being punctual in comparison with the target over the same period.
Overview
It is clear that the figures in both graphs fluctuated over the nine-year period. Ridership peaked at the mid-period (2004 2005), while the percentage of punctual trains reached its peak towards the end of the period measured.
Body Paragraph 1
The number of people riding the train started at 36 million in 2000. Over the next five-year period, there was an overall increase in the figures for train passengers, despite a dip between 2002 and 2003. The ridership peaked at around 47 million in 2005, then declined gradually until 2008. From 2008 to the end of the period shown, the figure rose by roughly 1 million.
Body Paragraph 2
The target for the percentage of train punctuality was a constant 95% throughout the period. In the year 2000, the actual figure was 3% short. It picked up to meet the target in 2002, before taking a steady and gradual rise to 96% in the next 2 years. However, the figure took a sharp dive of 4% from 2004 to 2006 to be the same as the original 2000 figure. From 2006 to 2008, there was a surge in the proportion of punctual trains to reach its peak of 97%, before levelling off in the last year of the period.
B. Analyze (Phân Tích)
(Nhấn vào đây để xem hướng dẫn)
Sau khi đã dịch xong các câu trong phần A, các bạn hãy đưa ra nhận xét về vai trò của từng phần và câu trong bài writing trên nhé

Hãy nhấn vào đây để xem toàn bộ nội dung của bài!
Introduction
The first picture shows the layout of an art gallery, and the second shows some The first line graph illustrates the figures for rail users between 2000 and 2009. The second graph shows the percentage of trains being punctual in comparison with the target over the same period.
Overview
It is clear that the figures in both graphs fluctuated over the nine-year period. Ridership peaked at the mid-period (2004 2005), while the percentage of punctual trains reached its peak towards the end of the period measured.
Body Paragraph 1
The number of people riding the train started at 36 million in 2000. Over the next five-year period, there was an overall increase in the figures for train passengers, despite a dip between 2002 and 2003. The ridership peaked at around 47 million in 2005, then declined gradually until 2008. From 2008 to the end of the period shown, the figure rose by roughly 1 million.
Body Paragraph 2
The target for the percentage of train punctuality was a constant 95% throughout the period. In the year 2000, the actual figure was 3% short. It picked up to meet the target in 2002, before taking a steady and gradual rise to 96% in the next 2 years. However, the figure took a sharp dive of 4% from 2004 to 2006 to be the same as the original 2000 figure. From 2006 to 2008, there was a surge in the proportion of punctual trains to reach its peak of 97%, before levelling off in the last year of the period.
Introduction
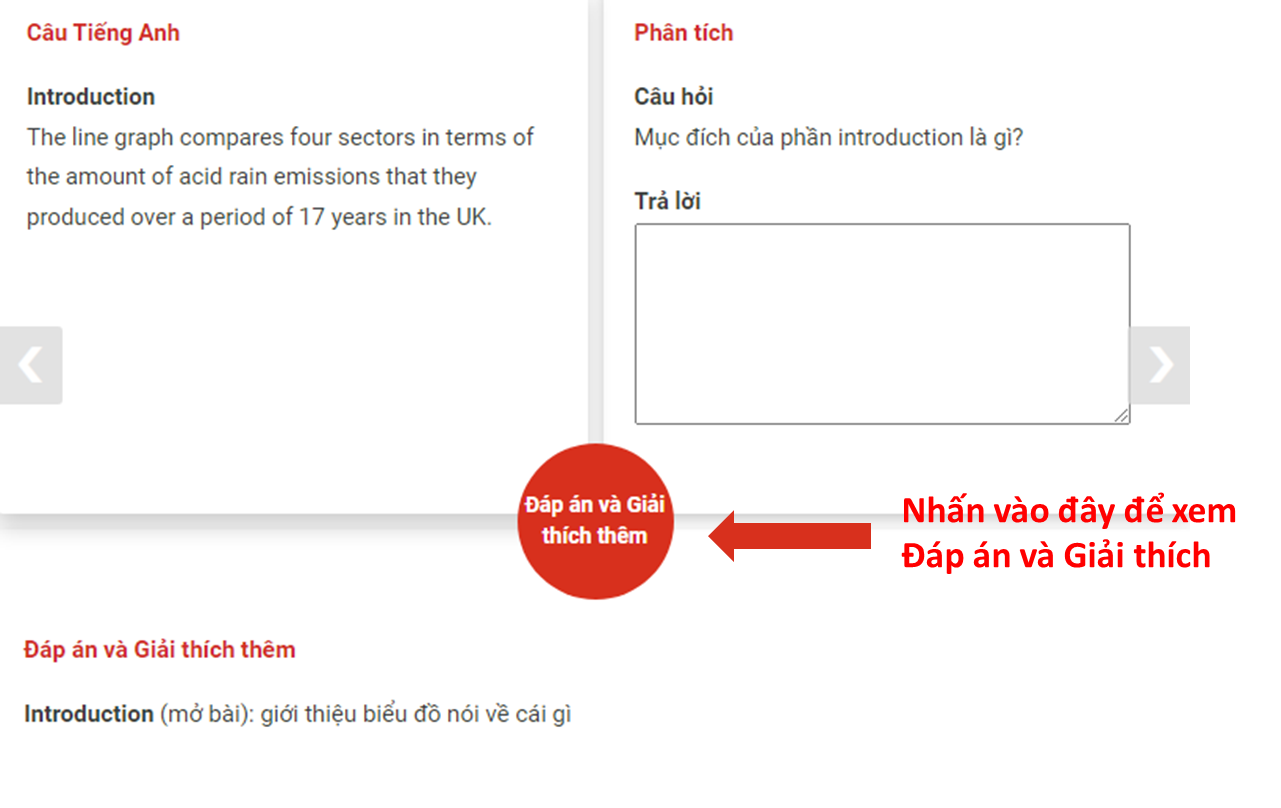
The first line graph illustrates the figures for rail users between 2000 and 2009. The second graph shows the percentage of trains being punctual in comparison with the target over the same period.
Câu hỏi
Mục đích của phần introduction là gì?
Trả lời
Introduction (mở bài): giới thiệu biểu đồ nói về cái gì
The first line graph illustrates the figures for rail users between 2000 and 2009.
Câu hỏi
Biểu đồ nói về cái gì?
Trả lời
Trong câu mở bài, thường bao giờ cũng có các cấu thành What PTCU: (What Place, Time, Categories, Unit)
What: Tên số liệu (nói về cái gì)
Place: địa điểm phát sinh số liệu (trong trường hợp này không có -> bỏ)
Time: Thời gian phát sinh số liệu
Categories: số mục phân loại số liệu (trong trường hợp này không có -> bỏ)
Unit: đơn vị đo số liệu
Overview
It is clear that the figures in both graphs fluctuated over the nine-year period. Ridership peaked at the mid-period (2004 – 2005), while the percentage of punctual trains reached its peak towards the end of the period measured.
Câu hỏi
Mục đích của phần overview là gì?
Trả lời
Overview (tổng quan): Nêu những điều người xem chỉ cần mới xem qua hình ảnh biểu đồ (chưa cần xem số liệu cụ thể) là đã có thể thấy được
Câu 1 – Overview
It is clear that the figures in both graphs fluctuated over the nine-year period.
Câu hỏi
Nội dung của câu 1 phần này nói về điều gì?
Trả lời
Nội dung của câu 1: Xu hướng chung của 2 biểu đồ
Giải thích thêm: Thường trong bài Line Graph, sẽ có xu hướng chung (tăng & giảm). Đây là điều dễ nhìn thấy nhất: chỉ cần xem các đường trên biểu đồ đi lên hay xuống.
Câu 2 – Overview
Ridership peaked at the mid-period (2004 – 2005), while the percentage of punctual trains reached its peak towards the end of the period measured.
Câu hỏi
Nội dung của câu 2 phần này nói về điều gì?
Trả lời
Nội dung của câu 2: Mức tăng mạnh nhất của biểu đồ 1 vào khoảng 2004 – 2005, và của biểu đồ 2 vào cuối thời kì.
Giải thích thêm:
Ngoài xu hướng chung, nên so sánh các năm với nhau và nêu ra category nổi bật nhất, ở đây là năm có mức tăng mạnh nhất ở cả 2 biểu đồ.
Body paragraph 1
The number of people riding the train started at 36 million in 2000. Over the next five-year period, there was an overall increase in the figures for train passengers, despite a dip between 2002 and 2003. The ridership peaked at around 47 million in 2005, then declined gradually until 2008. From 2008 to the end of the period shown, the figure rose by roughly 1 million.
Câu hỏi
Mục đích của phần paragraph 1 là gì?
Trả lời
Body paragraph 1: Nêu số liệu của biểu đồ 1
Câu 1 – Body 1
The number of people riding the train started at 36 million in 2000.
Câu hỏi
Nội dung của câu 1 phần này nói về điều gì?
Trả lời
Nội dung của câu 1: nêu số liệu năm đầu tiên của giai đoạn (2000) – 36 million people
Giải thích thêm:
Đối với những bài theo giai đoạn năm và chỉ có 1 đường duy nhất, ta sẽ miêu tả theo từng giai đoạn.
Câu 2 – Body 1
Over the next five-year period, there was an overall increase in the figures for train passengers, despite a dip between 2002 and 2003.
Câu hỏi
Nội dung của câu 2 phần này nói về điều gì?
Trả lời
Nội dung của câu 2: nêu số liệu 5 năm tiếp theo của biểu đồ: tăng nhưng có sự giảm nhẹ vào năm 2002 – 2003.
Giải thích thêm: Những năm có xu hướng đồ thị gần giống nhau sẽ được nêu trong cùng 1 câu.
Câu 3 – Body 1
The ridership peaked at around 47 million in 2005, then declined gradually until 2008.
Câu hỏi
Nội dung của câu 3 phần này nói về điều gì?
Trả lời
Nội dung của câu 3: nêu số liệu cao nhất của đồ thị (47 million) và xu hướng tiếp theo.
Giải thích thêm: Miêu tả số liệu cao nhất của đồ thị và xu hướng trong giai đoạn tiếp theo trước khi có sự thay đổi.
Câu 4 – Body 1
From 2008 to the end of the period shown, the figure rose by roughly 1 million.
Câu hỏi
Nội dung của câu 4 phần này nói về điều gì?
Trả lời
Nội dung của câu 4: nêu số liệu giai đoạn còn lại của đồ thị: tăng khoảng 1 triệu người
Giải thích thêm: Miêu tả số liệu còn lại của đồ thị cho tới hết giai đoạn
Body Paragraph 2
The target for the percentage of train punctuality was a constant 95% throughout the period. In the year 2000, the actual figure was 3% short. It picked up to meet the target in 2002, before taking a steady and gradual rise to 96% in the next 2 years. However, the figure took a sharp dive of 4% from 2004 to 2006 to be the same as the original 2000 figure.From 2006 to 2008, there was a surge in the proportion of punctual trains to reach its peak of 97%, before levelling off in the last year of the period.
Câu hỏi
Mục đích của phần paragraph 2 là gì?
Trả lời
Body paragraph 2 (Thân bài 2): miêu tả phần giữa + bên trái phòng trưng bày
Câu 1 – Body 2
The target for the percentage of train punctuality was a constant 95% throughout the period.
Câu hỏi
Nội dung của câu 1 phần này nói về điều gì?
Trả lời
Nội dung của câu 1: nêu mức mục tiêu phần trăm số lượng tàu đúng giờ trong suốt giai đoạn.
Giải thích thêm:
Biểu đồ 2 có 2 đồ thị: đồ thị về mục tiêu phần trăm số lượng tàu đúng giờ và phần trăm thực tế. Vậy số liệu mục tiêu sẽ là số liệu được đưa ra để làm tiêu chuẩn so sánh.
=> Miêu tả số liệu mục tiêu trước.
Ở đây số liệu mục tiêu không thay đổi trong suốt giai đoạn. => Chỉ cần 1 câu miêu tả khái quát.
Câu 2 – Body 2
In the year 2000, the actual figure was 3% short.
Câu hỏi
Nội dung của câu 2 phần này nói về điều gì?
Trả lời
Nội dung của câu 2: nêu số liệu thực tế năm đầu tiên của giai đoạn (2000) và so sánh với mục tiêu (3% thấp hơn)
Giải thích thêm: Chúng ta bắt đầu miêu tả theo trình tự thời gian từ đầu giai đoạn. Chú ý so sánh với số liệu mục tiêu (3% short)
Câu 3 – Body 2
It picked up to meet the target in 2002, before taking a steady and gradual rise to 96% in the next 2 years.
Câu hỏi
Nội dung của câu 3 phần này nói về điều gì?
Trả lời
Nội dung của câu 3: nêu số liệu thực tế giai đoạn tiếp theo (2002 – 2004): tăng trong năm 2002 đạt mục tiêu và tiếp tục tăng.
Giải thích thêm:
Miêu tả số liệu những năm tiếp theo. Chú ý so sánh với mục tiêu ở những điểm trùng (meet the target in 2002).
Những năm liên tiếp có xu hướng số liệu giống nhau sẽ được gộp vào.
Câu 4 – Body 2
However, the figure took a sharp dive of 4% from 2004 to 2006 to be the same as the original 2000 figure.
Câu hỏi
Nội dung của câu 4 phần này nói về điều gì?
Trả lời
Nội dung của câu 4: nêu số liệu thực tế giai đoạn tiếp theo (2002 – 2004): tăng trong năm 2002 đạt mục tiêu và tiếp tục tăng.
Giải thích thêm:
Nêu số liệu giai đoạn tiếp theo. Số liệu này sẽ có xu hướng khác so với giai đoạn ở Câu 3. Chú ý so sánh liên hệ với các năm trước nếu có thể (same as the original 2000 figure).
Câu 5 – Body 2
From 2006 to 2008, there was a surge in the proportion of punctual trains to reach its peak of 97%, before levelling off in the last year of the period.
Câu hỏi
Nội dung của câu 5 phần này nói về điều gì?
Trả lời
Nội dung của câu 5: nêu số liệu thực tế giai đoạn còn lại (2006 – 2008): Tăng mạnh rồi ổn định vào năm cuối.
Giải thích thêm:
Nêu số liệu những năm còn lại của đồ thị. Chú ý nêu ra những điểm nổi bật (trong trường hợp này là điểm cao nhất) và các xu hướng thay đổi trong giai đoạn.
C. Bảng Tổng Hợp Từ Vựng
| Từ vựng | Nghĩa |
| illustrate (v) The first line graph illustrates the figures for rail users between 2000 and 2009. | minh họa Biểu đồ đường đầu tiên minh họa số liệu về người sử dụng đường sắt từ năm 2000 đến năm 2009. |
| figure (n) The first line graph illustrates the figures for rail users between 2000 and 2009. | số liệu Biểu đồ đường đầu tiên minh họa số liệu về người sử dụng đường sắt từ năm 2000 đến năm 2009. |
| punctual (adj) The second graph shows the percentage of trains being punctual in comparison with the target over the same period. | đúng giờ Biểu đồ thứ hai cho thấy tỷ lệ phần trăm các chuyến tàu đúng giờ so với mục tiêu trong cùng thời kỳ. |
| target (n) The second graph shows the percentage of trains being punctual in comparison with the target over the same period. | mục tiêuBiểu đồ thứ hai cho thấy tỷ lệ phần trăm các chuyến tàu đúng giờ so với mục tiêu trong cùng thời kỳ. |
| fluctuate (v)It is clear that the figures in both graphs fluctuated over the nine-year period. | dao động Rõ ràng là các số liệu trong cả hai biểu đồ đều dao động trong khoảng thời gian chín năm. |
| Ridership (n) Ridership peaked at the mid-period (2004 2005), while the percentage of punctual trains reached its peak towards the end of the period measured. | Số hành khách Số hành khách đạt đỉnh vào thời kỳ giữa (2004 2005), trong khi tỷ lệ các chuyến tàu đúng giờ đạt đỉnh vào cuối thời kỳ được đo lường. |
| reach its peak Ridership peaked at the mid-period (2004 2005), while the percentage of punctual trains reached its peak towards the end of the period measured. | đạt đỉnh Số hành khách đạt đỉnh vào giữa thời kỳ giữa (2004 2005), trong khi tỷ lệ các chuyến tàu đúng giờ đạt đỉnh vào cuối thời kỳ được đo lường. |
| The number of + N (plural) The number of people riding the train started at 36 million in 2000. | Số lượng người Số lượng người đi tàu bắt đầu ở mức 36 triệu người vào năm 2000. |
| start at The number of people riding the train started at 36 million in 2000. | bắt đầu ở Số lượng người đi tàu bắt đầu ở mức 36 triệu người vào năm 2000. |
| passenger (n) Over the next five-year period, there was an overall increase in the figures for train passengers, despite a dip between 2002 and 2003. | hành khách Trong khoảng thời gian 5 năm tiếp theo, có một sự tăng lên tổng thể/nhìn chung trong số lượng hành khách đi tàu , mặc dù có sự sụt giảm trong giai đoạn 2002-2003. |
| dip Over the next five-year period, there was an overall increase in the figures for train passengers, despite a dip between 2002 and 2003. | sự sụt giảm Trong khoảng thời gian 5 năm tiếp theo, có một sự tăng lên tổng thể/nhìn chung trong số lượng hành khách đi tàu , mặc dù có sự sụt giảm trong giai đoạn 2002-2003. |
| peak at The ridership peaked at around 47 million in 2005, then declined gradually until 2008. | đạt đỉnh Số lượng hành khách đạt đỉnh khoảng 47 triệu người vào năm 2005, sau đó giảm dần cho đến năm 2008. |
| declined gradually The ridership peaked at around 47 million in 2005, then declined gradually until 2008. | giảm dần Số lượng hành khách đạt đỉnh khoảng 47 triệu người vào năm 2005, sau đó giảm dần cho đến năm 2008. |
| roughly From 2008 to the end of the period shown, the figure rose by roughly 1 million. | khoảng Từ năm 2008 đến cuối giai đoạn được hiển thị, con số này đã tăng khoảng 1 triệu. |
| punctuality (n) The target for the percentage of train punctuality was a constant 95% throughout the period. | đúng giờ Mục tiêu về tỷ lệ chuyến tàu đúng giờ là 95% không đổi trong suốt thời kỳ. |
| constant (adj) The target for the percentage of train punctuality was a constant 95% throughout the period. | không đổi Mục tiêu về tỷ lệ chuyến tàu đúng giờ là 95% không đổi trong suốt thời kỳ. |
| actual (adj) In the year 2000, the actual figure was 3% short. | thực tế Vào năm 2000, con số thực tế là thấp hơn 3%. |
| short (adv) In the year 2000, the actual figure was 3% short. | thấp hơn Vào năm 2000, con số thực tế là thấp hơn 3%. |
| pick up It picked up to meet the target in 2002, before taking a steady and gradual rise to 96% in the next 2 years. | tăng Nó đã tăng để đạt được mục tiêu vào năm 2002, trước khi tăng đều đặn và dần dần lên 96% trong 2 năm tiếp theo. |
| steady (adj) It picked up to meet the target in 2002, before taking a steady and gradual rise to 96% in the next 2 years. | đều đặn Nó đã tăng để đạt được mục tiêu vào năm 2002, trước khi tăng đều đặn và dần dần lên 96% trong 2 năm tiếp theo. |
| sharp dive However, the figure took a sharp dive of 4% from 2004 to 2006 to be the same as the original 2000 figure. | giảm mạnh Tuy nhiên, con số này đã giảm mạnh 4% từ năm 2004 đến năm 2006 để bằng với con số ban đầu của năm 2000. |
| the same as However, the figure took a sharp dive of 4% from 2004 to 2006 to be the same as the original 2000 figure. | bằng với Tuy nhiên, con số này đã giảm mạnh 4% từ năm 2004 đến năm 2006 để bằng với con số ban đầu của năm 2000. |
| surge (n) From 2006 to 2008, there was a surge in the proportion of punctual trains to reach its peak of 97%, before levelling off in the last year of the period. | tăng mạnh Từ năm 2006 đến năm 2008, có sự tăng mạnh trong tỷ lệ các chuyến tàu đúng giờ, đạt mức cao nhất là 97%, trước khi chững lại vào năm cuối cùng của giai đoạn này. |
| level off from 2006 to 2008, there was a surge in the proportion of punctual trains to reach its peak of 97%, before levelling off in the last year of the period. | chững lại Từ năm 2006 đến năm 2008, có sự tăng mạnh trong tỷ lệ các chuyến tàu đúng giờ, đạt mức cao nhất là 97%, trước khi chững lại vào năm cuối cùng của giai đoạn này. |
D. Rewrite (Viết lại)
Sau khi đã nắm vững các từ vựng, ngữ pháp và cấu trúc của bài viết các bạn hãy viết lại bài theo định hướng sau nhé!
Introduction: giới thiệu biểu đồ nói về cái gì
What: the figures for rail users & the percentage of trains being punctual in comparison with the target
Time: 2000 to 2009
Unit: million people and percentage
Overview (tổng quan): Nêu những điều người xem chỉ cần mới xem qua hình ảnh biểu đồ (chưa cần xem số liệu cụ thể) là đã có thể thấy được
Overview 1:
Xu hướng chung của 2 biểu đồ
Overview 2:
Mức tăng mạnh nhất của biểu đồ 1 vào khoảng 2004 – 2005, và của biểu đồ 2 vào cuối thời kì.
Body 1 – 4 câu
Câu 1 – Body 1 – nêu số liệu năm đầu tiên của giai đoạn (2000) – 36 million people
Câu 2 – Body 1 – nêu số liệu 5 năm tiếp theo của biểu đồ: tăng nhưng có sự giảm nhẹ vào năm 2002 – 2003.
Câu 3 – Body 1 – nêu số liệu cao nhất của đồ thị (47 million) và xu hướng tiếp theo.
Câu 4 – Body 1 – nêu số liệu giai đoạn còn lại của đồ thị: tăng khoảng 1 triệu người
Body 2 – 4 câu
Câu 1 – Body 2 – nêu mức mục tiêu phần trăm số lượng tàu đúng giờ trong suốt giai đoạn.
Câu 2 – Body 2 – nêu số liệu thực tế năm đầu tiên của giai đoạn (2000) và so sánh với mục tiêu (3% thấp hơn)
Câu 3 – Body 2 – nêu số liệu thực tế giai đoạn tiếp theo (2002 – 2004): tăng trong năm 2002 đạt mục tiêu và tiếp tục tăng.
Câu 4 – Body 2 – nêu số liệu thực tế giai đoạn 2004 – 2006: Giảm mạnh 4%.
Câu 5 – Body 2 – nêu số liệu thực tế giai đoạn còn lại (2006 – 2008): Tăng mạnh rồi ổn định vào năm cuối.
Đề bài: The first graph shows the number of train passengers from 2000 to 2009; the second compares the percentage of trains running on time and target in the period.
Bài làm