Trong bài viết này, các bạn hãy cùng IZONE phân tích cách viết của giảng viên IZONE và hoàn thiện bài writing task 1 sau đây nhé!
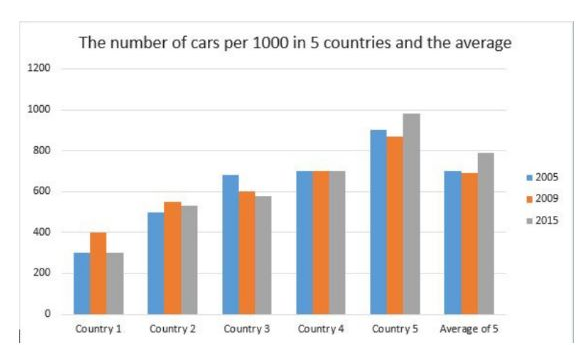
Đề bài: The bar chart shows the number of cars per 1000 people in five European countries over the 3 years 2005, 2009, 2015, compared with the European average.
A. Translation (Dịch)
Trước khi đi sâu vào phân tích cấu trúc bài Ielts Writing Task 1 trên, các bạn hãy làm bài dịch sau để có thể củng cố thêm từ vựng và ngữ pháp khi gặp đề writing này nhé.
(Nhấn vào đây để xem hướng dẫn)
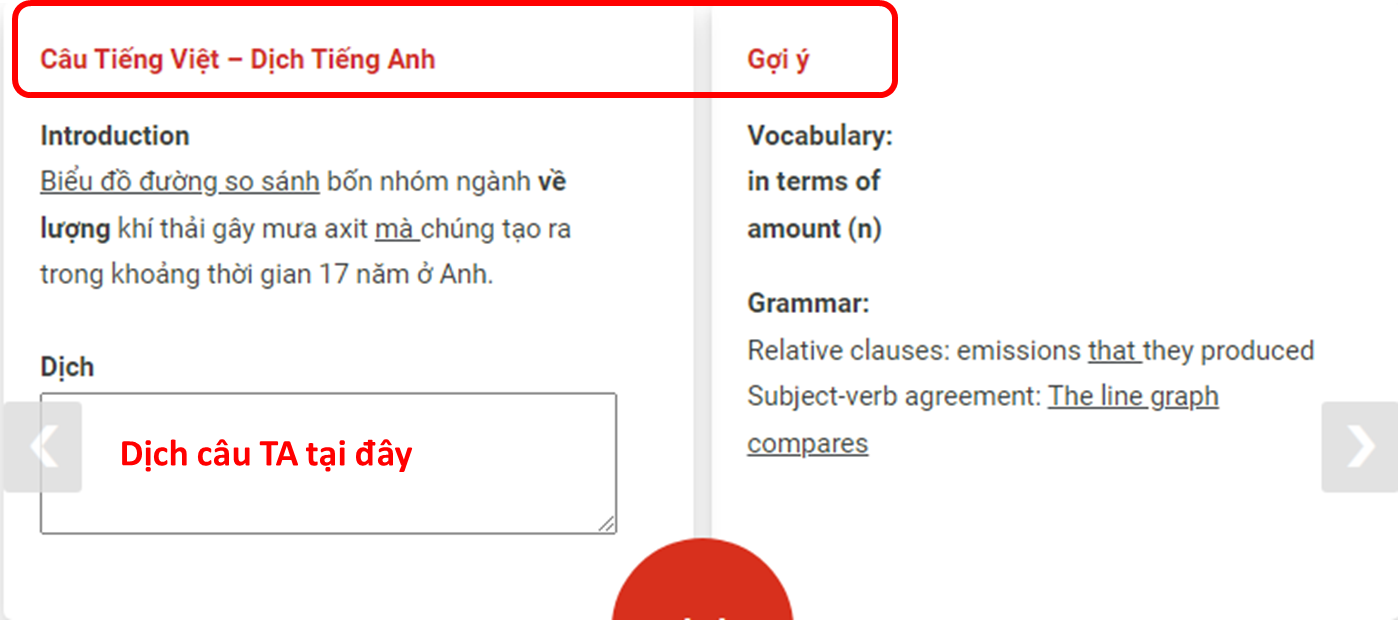
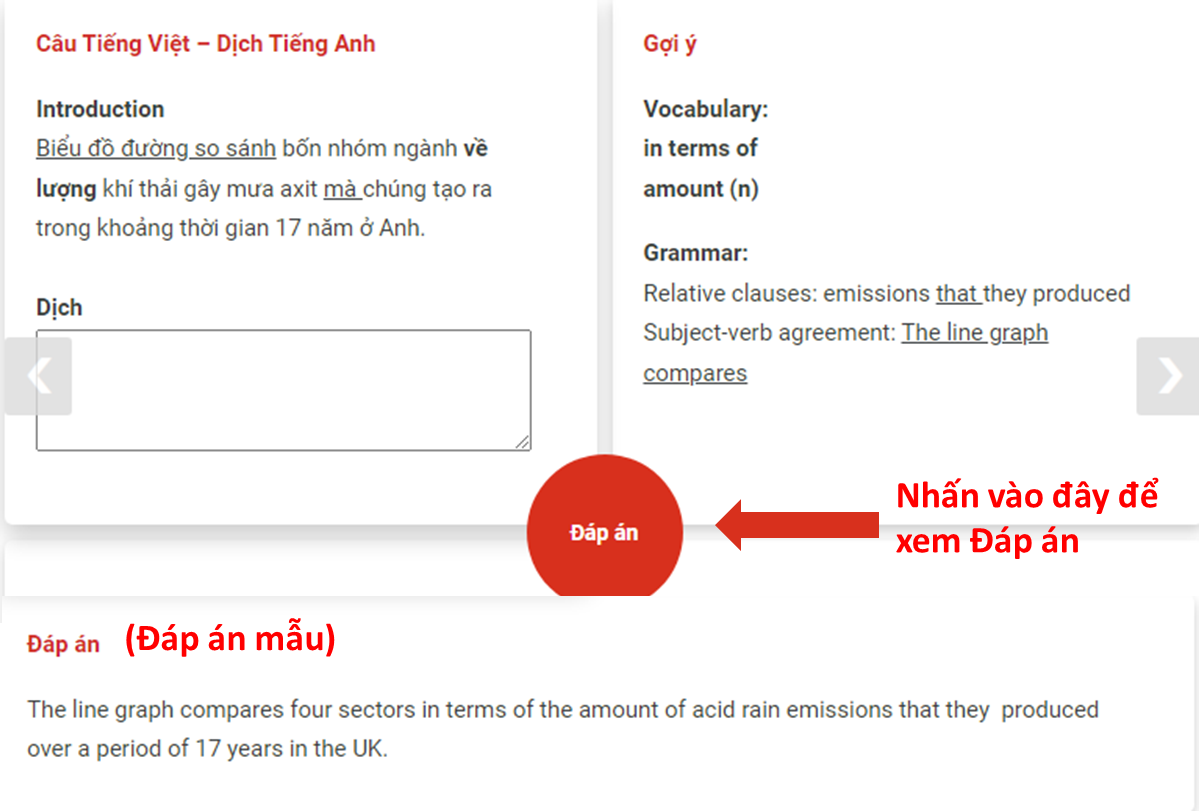
Introduction
Biểu đồ cột đã cho minh họa số liệu sở hữu ô tô của 5 quốc gia ở Châu Âu so với mức trung bình của Châu Âu từ năm 2005 đến 2015.
Dịch
Vocabulary:
Ownership (n)
In comparison with
Grammar:
“The” as a definite article: …the European average…
The given bar chart illustrates the car ownership figures for five nations in Europe in comparison with the European average between 2005 and 2015.
Overview
Nhìn chung, có thể thấy rõ rằng phần lớn người dân ở quốc gia số 5 là chủ sở hữu ô tô.
Dịch
Vocabulary:
apparent (adj)
the majority of
Grammar:
Subject-verb agreement: plural noun + plural verb (were)
Generally, it is apparent that the majority of people in country 5 were car owners.
Bên cạnh đó, số liệu thống kê về lượng ô tô được sở hữu trên một nghìn người ở bốn trong số năm quốc gia đã trải qua sự biến động rõ rệt trong suốt mười năm.
Dịch
Vocabulary:
Visible (adj)
Fluctuation (n)
Over the course of + time range
Grammar:
Linking word: Also…
Shortened relative clause: …cars owned…
Also, the statistics of cars owned per a thousand people in four of the five countries experienced visible fluctuation over the course of ten years.
Body Paragraph 1
Theo biểu đồ cột, quốc gia 1 ghi nhận 300 ô tô trên 1000 dân vào năm 2005.
Dịch
Vocabulary:
According to N
Record (v)
According to the bar chart, country 1 recorded 300 cars per 1000 people in the year 2005.
Con số tăng nhẹ lên 400 vào năm 2009 trước khi giảm xuống mức khởi điểm sáu năm sau đó.
Dịch
Vocabulary:
Rise to N
Drop to N
Grammar:
Irregular past simple: rise->rose
Before + V-ing
The number slightly rose to 400 in 2009 before dropping to its starting point six years later.
Tương tự, quốc gia 2 chứng kiến tỷ lệ sở hữu ô tô của mình trải qua những biến động nhỏ, cụ thể lần lượt là 500, 570 và 560 trong các năm 2005, 2009 và 2015.
Dịch
Vocabulary:
Undergo (v)
Minor (adj)
Grammar:
Plural noun: …fluctuations…
Linking word: Similarly…
Participle clause: …,reporting…
Similarly, country 2 saw its car ownership undergo minor fluctuations, reporting 500, 570 and 560 in 2005, 2009 and 2015 respectively.
Ngược lại, số liệu sở hữu ô tô ở quốc gia 3 chứng kiến xu hướng giảm nhất quán, ban đầu ở khoảng 700, theo sau đó là sự giảm dần xuống còn 580 trong mười năm sau.
Dịch
Vocabulary:
witness (v)
consistent (adj)
Downward trend
Grammar:
Linking word: In contrast…
Participle clause: …starting with…
Relative clause: …,which was…
In contrast, the figure for car ownership in country 3 witnessed a consistent downward trend, starting the period at about 700, which was followed by a gradual decrease to 580 in the following ten years.
Body paragraph 2
Trong khi đó, dữ liệu được cung cấp ở quốc gia 4 giữ nguyên ở mức 700 trong cả ba năm nghiên cứu.
Dịch
Vocabulary:
under study
Grammar:
Linking verb: verb + adj (…remained unchanged…)
Meanwhile, the provided data in country 4 remained unchanged at 700 during all three years under study.
Đối với quốc gia 5, bắt đầu ở mức 900 vào năm 2005, số lượng ô tô được sở hữu trên một nghìn dân giảm nhẹ xuống còn 870 chiếc, nhưng đã tăng lên gần 1000 chiếc vào năm 2015 – cao nhất trong toàn bộ năm quốc gia được nghiên cứu.
Dịch
Grammar:
Linking word:
with reference to N
….yet….
Superlative comparison:…the highest..
With reference to country 5, starting off at 900 in 2005, the number of cars owned per thousand slightly dropped to 870, yet rose to nearly 1000 in 2015 – the highest among all five studied countries.
Cũng sẽ có một phòng mới cho các cuộc triển lãm đặc biệt.
Dịch
Vocabulary:
special (adj)
Grammar:
Future: There will also beSingular noun: room (countable)
The same pattern was seen in the European average with about 700 in 2005 and a marginal decrease in 2009, followed by an increase to nearly 800 in 2015.
Xu hướng tương tự cũng được thấy ở mức trung bình của châu Âu với khoảng 700 xe vào năm 2005 và sự giảm nhẹ vào năm 2009, mà theo sau đó là sự tăng lên mức gần 800 vào năm 2015.
Dịch
Vocabulary:
Pattern (n)
Marginal (adj)
Grammar:
Participle clause (past participle): …followed by…
This room is shown in red on the existing plan and is not currently part of the gallery.
Để xem bài dịch hoàn thiện các bạn hãy nhấn vào đây nhé!
Introduction
The given bar chart illustrates the car ownership figures for five nations in Europe in comparison with the European average between 2005 and 2015.
Overview
Generally, it is apparent that the majority of people in country 5 were car owners. Also, the statistics of cars owned per a thousand people in four of the five countries experienced visible fluctuation over the course of ten years.
Body Paragraph 1
According to the bar chart, country 1 recorded 300 cars per 1000 people in the year 2005. The number slightly rose to 400 in 2009 before dropping to its starting point six years later. Similarly, country 2 saw its car ownership undergo minor fluctuations, reporting 500, 570 and 560 in 2005, 2009 and 2015 respectively. In contrast, the figure for car ownership in country 3 witnessed a consistent downward trend, starting the period at about 700, which was followed by a gradual decrease to 580 in the following ten years.
Body Paragraph 2
Meanwhile, the provided data in country 4 remained unchanged at 700 during all three years under study. With reference to country 5, starting off at 900 in 2005, the number of cars owned per thousand slightly dropped to 870, yet rose to nearly 1000 in 2015 – the highest among all five studied countries. The same pattern was seen in the European average with about 700 in 2005 and a marginal decrease in 2009, followed by an increase to nearly 800 in 2015.
B. Analyze (Phân Tích)
(Nhấn vào đây để xem hướng dẫn)
Sau khi đã dịch xong các câu trong phần A, các bạn hãy đưa ra nhận xét về vai trò của từng phần và câu trong bài writing trên nhé
Hãy nhấn vào đây để xem toàn bộ nội dung của bài!
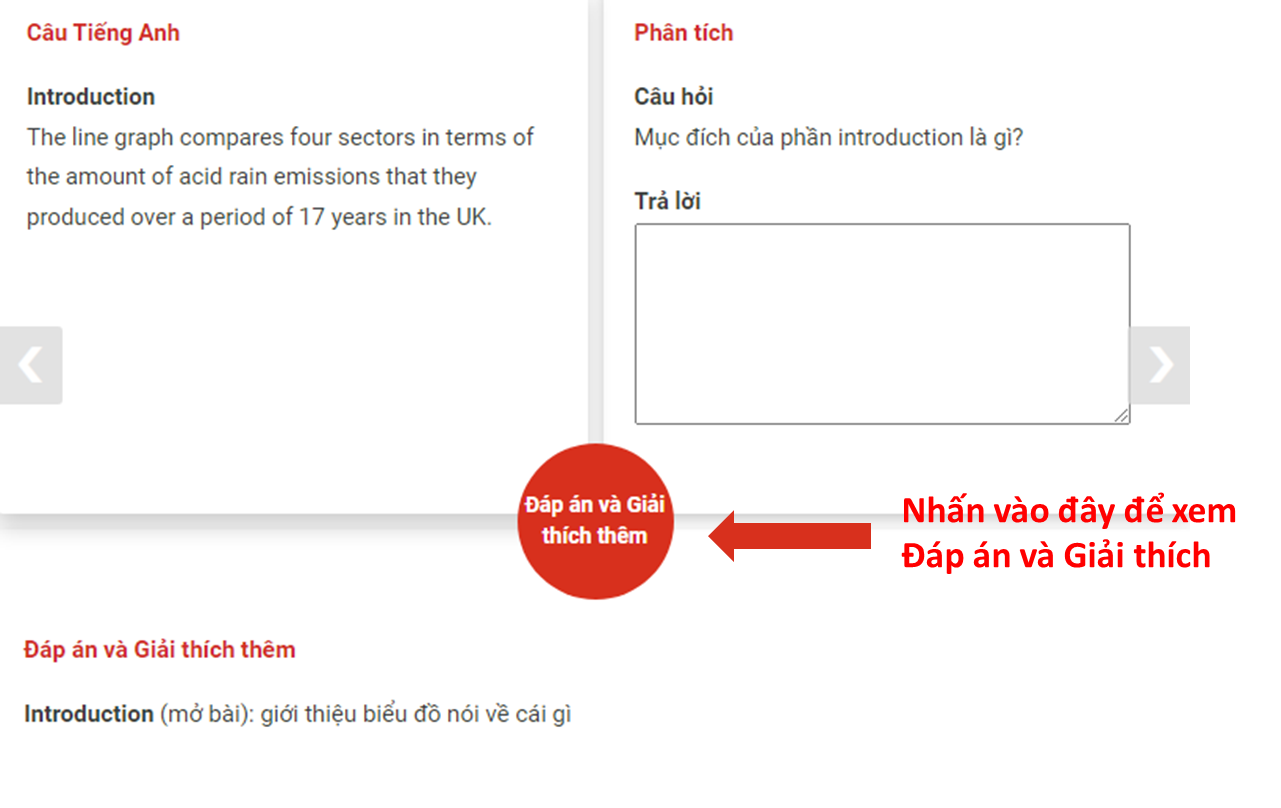
Introduction
The given bar chart illustrates the car ownership figures for five nations in Europe in comparison with the European average between 2005 and 2015.
Overview
Generally, it is apparent that the majority of people in country 5 were car owners. Also, the statistics of cars owned per a thousand people in four of the five countries experienced visible fluctuation over the course of ten years.
Body Paragraph 1
According to the bar chart, country 1 recorded 300 cars per 1000 people in the year 2005. The number slightly rose to 400 in 2009 before dropping to its starting point six years later. Similarly, country 2 saw its car ownership undergo minor fluctuations, reporting 500, 570 and 560 in 2005, 2009 and 2015 respectively. In contrast, the figure for car ownership in country 3 witnessed a consistent downward trend, starting the period at about 700, which was followed by a gradual decrease to 580 in the following ten years.
Body Paragraph 2
Meanwhile, the provided data in country 4 remained unchanged at 700 during all three years under study. With reference to country 5, starting off at 900 in 2005, the number of cars owned per thousand slightly dropped to 870, yet rose to nearly 1000 in 2015 – the highest among all five studied countries. The same pattern was seen in the European average with about 700 in 2005 and a marginal decrease in 2009, followed by an increase to nearly 800 in 2015.
Introduction
The given bar chart illustrates the car ownership figures for five nations in Europe in comparison with the European average between 2005 and 2015.
Câu hỏi
Mục đích của phần introduction là gì?
Trả lời
Introduction (mở bài): giới thiệu biểu đồ nói về cái gì
The given bar chart illustrates the car ownership figures for five nations in Europe in comparison with the European average between 2005 and 2015.
Câu hỏi
Biểu đồ nói về cái gì?
Trả lời
Intro
What: the car ownership
Place: Europe
Time: 2005-2015
Categories: five European countries and the average of 5.Unit: the number of
Giải thích
Trong câu mở bài, thường bao giờ cũng có các cấu thành What PTCU: (What Place, Time, Categories, Unit)
What: Tên số liệu (nói về cái gì)
Place: địa điểm phát sinh số liệu
Time: Thời gian phát sinh số liệu
Categories: số mục phân loại số liệu (2 giai đoạn: 1990-1995; 1996-2002)
Unit: đơn vị đo số liệu
Overview
Generally, it is apparent that the majority of people in country 5 were car owners. Also, the statistics of cars owned per a thousand people in four of the five countries experienced visible fluctuation over the course of ten years.
Câu hỏi
Mục đích của phần overview là gì?
Trả lời
Overview (tổng quan): Nêu những điều người xem chỉ cần mới xem qua hình ảnh biểu đồ (chưa cần xem số liệu cụ thể) là đã có thể thấy được
Câu 1 – Overview
Generally, it is apparent that the majority of people in country 5 were car owners.
Câu hỏi
Nội dung của câu 1 phần này nói về điều gì?
Trả lời
Nội dung của câu 1: Country 5 là nước có số liệu cao nhất trong tất cả các nhóm..
Giải thích thêm:
Dữ liệu trong bài được phân loại dựa trên 2 tiêu chí:
1) Đất nước: 5 đất nước
2) Thời điểm lấy số liệu: 3 mốc năm
Đoạn Overview cần nói đến cả 2 tiêu chí này. Câu Overview 1 này đã nói được tiêu chí 1 – nêu ra nước có số liệu cao nhất.
Câu 2 – Overview
Also, the statistics of cars owned per a thousand people in four of the five countries experienced visible fluctuation over the course of ten years.
Câu hỏi
Nội dung của câu 2 phần này nói về điều gì?
Trả lời
Nội dung của câu 2: Số lượng người sở hữu xe ô tô biến động một cách rõ ràng qua 10 năm.
Giải thích thêm:
So sánh thời điểm lấy số liệu: chi ra xu hướng chung nhất của tất cả các nhóm nước qua các năm
Body paragraph 1
According to the bar chart, country 1 recorded 300 cars per 1000 people in the year 2005. The number slightly rose to 400 in 2009 before dropping to its starting point six years later. Similarly, country 2 saw its car ownership undergo minor fluctuations, reporting 500, 570 and 560 in 2005, 2009 and 2015 respectively. In contrast, the figure for car ownership in country 3 witnessed a consistent downward trend, starting the period at about 700, which was followed by a gradual decrease to 580 in the following ten years.
Câu hỏi
Mục đích của phần paragraph 1 là gì?
Trả lời
Body paragraph 1: Nêu số liệu và xu hướng của 3 nước đầu tiên (Countries 1,2,3)
Câu 1 – Body 1
According to the bar chart, country 1 recorded 300 cars per 1000 people in the year 2005.
Câu hỏi
Nội dung của câu 1 phần này nói về điều gì?
Trả lời
Nội dung của câu 1: Nêu số liệu năm đầu của Country 1.
Giải thích thêm:
Vì có nhiều đối tượng (5 đất nước), ta không nên miêu tả số liệu của từng nước. Thay vào đó, ta sẽ nhóm các nước có đặc điểm tương đồng lại với nhau. 3 nước Country 1, Country 2 và Country 3 có số liệu thấp hơn so với các nhóm còn lại và xu hướng cũng có sự tương đồng nên cho vào cùng Body 1. Còn Body 2 sẽ bao gồm các nhóm có đặc điểm khá nổi bật và khác biệt đó là Country 4, và Country 5 và nhóm Average.
Câu 1 này nêu số liệu bắt đầu của nhóm đầu tiên.
Câu 2 – Body 1
The number slightly rose to 400 in 2009 before dropping to its starting point six years later.
Câu hỏi
Nội dung của câu 2 phần này nói về điều gì?
Trả lời
Nội dung của câu 2: Nêu xu hướng và số liệu năm cuối của Country 1.
Giải thích thêm: Cấu trúc S + V before V-ing dùng để mô tả 2 xu hướng liên tiếp nhau của cùng 1 đối tượng.
Câu 3 – Body 1
Similarly, country 2 saw its car ownership undergo minor fluctuations, reporting 500, 570 and 560 in 2005, 2009 and 2015 respectively.
Câu hỏi
Nội dung của câu 3 phần này nói về điều gì?
Trả lời
Nội dung của câu 3: Nêu số liệu trong 3 năm của Country 2.
Giải thích thêm:
Từ “Similarly” thể hiện sự so sánh tương đồng giữa xu hướng của Country 2 và Country 1.
Chính vì xu hướng tương tự nên ta không cần mô tả lại mà chỉ cần liệt kê số liệu của từng năm.
Câu 4 – Body 1
In contrast, the figure for car ownership in country 3 witnessed a consistent downward trend, starting the period at about 700, which was followed by a gradual decrease to 580 in the following ten years.
Câu hỏi
Nội dung của câu 4 phần này nói về điều gì?
Trả lời
Nội dung của câu 4: Nêu xu hướng và số liệu của Country 3.
Giải thích thêm:
Cụm “In contrast” thể hiện sự đối lập về xu hướng với Country 1 và Country 2.
Vì số liệu năm ở giữa không có gì nổi bật nên ta chỉ cần nêu số liệu năm đầu, sau đó nêu xu hướng và số liệu năm cuối.
Từ “consistent” thể hiện một xu hướng thống nhất từ đầu tới cuối (trong trường hợp này là đều giảm qua các năm chứ không có sự biến động nào ở giữa).
Cụm “followed by” dùng để nối giữa 2 xu hướng liên tiếp nhau của cùng 1 đối tượng.
Body Paragraph 2
Meanwhile, the provided data in country 4 remained unchanged at 700 during all three years under study. With reference to country 5, starting off at 900 in 2005, the number of cars owned per thousand slightly dropped to 870, yet rose to nearly 1000 in 2015 – the highest among all five studied countries. The same pattern was seen in the European average with about 700 in 2005 and a marginal decrease in 2009, followed by an increase to nearly 800 in 2015.
Câu hỏi
Mục đích của phần paragraph 2 là gì?
Trả lời
Body paragraph 2 (Thân bài 2): Nêu số liệu và xu hướng của 3 nhóm còn lại (Countries 4,5 và Average)
Câu 1 – Body 2
Meanwhile, the provided data in country 4 remained unchanged at 700 during all three years under study.
Câu hỏi
Nội dung của câu 1 phần này nói về điều gì?
Trả lời
Nội dung của câu 1: Nêu số liệu và xu hướng của Country 4.
Giải thích thêm: Vì số liệu của Country 4 không có gì thay đổi nên ta chỉ cần nói tóm gọn trong 1 câu.
Câu 2 – Body 2
With reference to country 5, starting off at 900 in 2005, the number of cars owned per thousand slightly dropped to 870, yet rose to nearly 1000 in 2015 – the highest among all five studied countries.
Câu hỏi
Nội dung của câu 2 phần này nói về điều gì?
Trả lời
Nội dung của câu 2: Nêu số liệu và xu hướng của Country 5.
Giải thích thêm:
Nêu số liệu năm đầu tiên sau đó nêu xu hướng cùng số liệu kèm theo và số liệu năm cuối cùng.
Cụm “With reference to” dùng để chuyển sang 1 category khác.
Từ “yet” thể hiện sự đối lập giữa 2 xu hướng trong 2 khoảng thời gian khác nhau.
Ngoài việc nêu xu hướng và số liệu, ta còn cần nêu lên được 1 đặc điểm rất nổi bật của Country 5, đó là việc Country này có số liệu cao nhất trong tất cả các nước. (the highest among all five studied countries)
Câu 3 – Body 2
The same pattern was seen in the European average with about 700 in 2005 and a marginal decrease in 2009, followed by an increase to nearly 800 in 2015.
Câu hỏi
Nội dung của câu 3 phần này nói về điều gì?
Trả lời
Nội dung của câu 3: Nêu số liệu và xu hướng của nhóm Average.
Giải thích thêm:
Cấu trúc “The same pattern was seen in…” là một cấu trúc hay ta có thể sử dụng để đưa ra 1 nhóm có sự tương đồng với nhóm đã nêu ở (các) câu trước.
Đối với cấu trúc này, ta còn có thể biến đổi phù hợp để dùng cho các nhóm có đặc điểm khác nhau, ví dụ: The pattern was quite different for…
C. Bảng Tổng Hợp Từ Vựng
| Từ vựng | Nghĩa |
| Ownership (n) The given bar chart illustrates the car ownership figures for five nations in Europe in comparison with the European average between 2005 and 2015. | sự sở hữu Biểu đồ cột đã cho minh họa số liệu sở hữu ô tô của 5 quốc gia ở Châu Âu so với mức trung bình của Châu Âu từ năm 2005 đến 2015. |
| In comparison withThe given bar chart illustrates the car ownership figures for five nations in Europe in comparison with the European average between 2005 and 2015. | so với Biểu đồ cột đã cho minh họa số liệu sở hữu ô tô của 5 quốc gia ở Châu Âu so với mức trung bình của Châu Âu từ năm 2005 đến 2015. |
| apparent (adj) Generally, it is apparent that the majority of people in country 5 were car owners. | rõ ràngNhìn chung, có thể thấy rõ rằng phần lớn người dân ở quốc gia số 5 là chủ sở hữu ô tô. |
| the majority of Generally, it is apparent that the majority of people in country 5 were car owners. | phần lớn Nhìn chung, có thể thấy rõ rằng phần lớn người dân ở quốc gia số 5 là chủ sở hữu ô tô. |
| Visible (adj) Also, the statistics of cars owned per a thousand people in four of the five countries experienced visible fluctuation over the course of ten years. | rõ rệt Bên cạnh đó, số liệu thống kê về lượng ô tô được sở hữu trên một nghìn người ở bốn trong số năm quốc gia đã trải qua sự biến động rõ rệt trong suốt mười năm. |
| Fluctuation (n) Also, the statistics of cars owned per a thousand people in four of the five countries experienced visible fluctuation over the course of ten years. | sự biến động Bên cạnh đó, số liệu thống kê về lượng ô tô được sở hữu trên một nghìn người ở bốn trong số năm quốc gia đã trải qua sự biến động rõ rệt trong suốt mười năm. |
| Over the course of + time range Also, the statistics of cars owned per a thousand people in four of the five countries experienced visible fluctuation over the course of ten years. | trong suốt… Bên cạnh đó, số liệu thống kê về lượng ô tô được sở hữu trên một nghìn người ở bốn trong số năm quốc gia đã trải qua sự biến động rõ rệt trong suốt mười năm. |
| According to N According to the bar chart, country 1 recorded 300 cars per 1000 people in the year 2005. | Theo…, dựa theo… Theo biểu đồ cột, quốc gia 1 ghi nhận 300 ô tô trên 1000 dân vào năm 2005. |
| Record (v) According to the bar chart, country 1 recorded 300 cars per 1000 people in the year 2005. | ghi nhận Theo biểu đồ cột, quốc gia 1 ghi nhận 300 ô tô trên 1000 dân vào năm 2005. |
| Rise to N The number slightly rose to 400 in 2009 before dropping to its starting point six years later. | tăng lên Con số tăng nhẹ lên 400 vào năm 2009 trước khi giảm xuống mức khởi điểm sáu năm sau đó. |
| Drop to N The number slightly rose to 400 in 2009 before dropping to its starting point six years later. | giảm xuống Con số tăng nhẹ lên 400 vào năm 2009 trước khi giảm xuống mức khởi điểm sáu năm sau đó. |
| Undergo (v) Similarly, country 2 saw its car ownership undergo minor fluctuations, reporting 500, 570 and 560 in 2005, 2009 and 2015 respectively. | trải qua Tương tự, quốc gia 2 chứng kiến tỷ lệ sở hữu ô tô của mình trải qua những biến động nhỏ, cụ thể lần lượt là 500, 570 và 560 trong các năm 2005, 2009 và 2015. |
| Minor (adj) Similarly, country 2 saw its car ownership undergo minor fluctuations, reporting 500, 570 and 560 in 2005, 2009 and 2015 respectively. | nhỏ Tương tự, quốc gia 2 chứng kiến tỷ lệ sở hữu ô tô của mình trải qua những biến động nhỏ, cụ thể lần lượt là 500, 570 và 560 trong các năm 2005, 2009 và 2015. |
| witness (v) In contrast, the figure for car ownership in country 3 witnessed a consistent downward trend, starting the period at about 700, which was followed by a gradual decrease to 580 in the following ten years. | chứng kiến Ngược lại, số liệu sở hữu ô tô ở quốc gia 3 chứng kiến xu hướng giảm nhất quán, ban đầu ở khoảng 700, theo sau đó là sự giảm dần xuống còn 580 trong mười năm sau. |
| consistent (adj) In contrast, the figure for car ownership in country 3 witnessed a consistent downward trend, starting the period at about 700, which was followed by a gradual decrease to 580 in the following ten years. | nhất quán Ngược lại, số liệu sở hữu ô tô ở quốc gia 3 chứng kiến xu hướng giảm nhất quán, Ban đầu ở khoảng 700, theo sau đó là sự giảm dần xuống còn 580 trong mười năm sau. |
| Downward trend In contrast, the figure for car ownership in country 3 witnessed a consistent downward trend, starting the period at about 700, which was followed by a gradual decrease to 580 in the following ten years. | xu hướng giảm Ngược lại, số liệu sở hữu ô tô ở quốc gia 3 chứng kiến xu hướng giảm nhất quán, ban đầu ở khoảng 700, theo sau đó là sự giảm dần xuống còn 580 trong mười năm sau. |
| under study Meanwhile, the provided data in country 4 remained unchanged at 700 during all three years under study. | được nghiên cứu Trong khi đó, dữ liệu được cung cấp ở quốc gia 4 giữ nguyên ở mức 700 trong cả ba năm nghiên cứu. |
| Pattern (n) The same pattern was seen in the European average with about 700 in 2005 and a marginal decrease in 2009, followed by an increase to nearly 800 in 2015. | Xu hướng Xu hướng tương tự cũng được thấy ở mức trung bình của châu Âu với khoảng 700 xe vào năm 2005 và sự giảm nhẹ vào năm 2009, mà theo sau đó là sự tăng lên mức gần 800 vào năm 2015. |
| Marginal (adj) The same pattern was seen in the European average with about 700 in 2005 and a marginal decrease in 2009, followed by an increase to nearly 800 in 2015. | nhẹ Xu hướng tương tự cũng được thấy ở mức trung bình của châu Âu với khoảng 700 xe vào năm 2005 và sự giảm nhẹ vào năm 2009, mà theo sau đó là sự tăng lên mức gần 800 vào năm 2015. |
D. Rewrite (Viết lại)
Sau khi đã nắm vững các từ vựng, ngữ pháp và cấu trúc của bài viết các bạn hãy viết lại bài theo định hướng sau nhé!
Introduction (mở bài): giới thiệu biểu đồ nói về cái gì
What: the car ownership
Place: Europe
Time: 2005-2015
Categories: five European countries and the average of 5.
Unit: the number of
Overview (tổng quan): Nêu những điều người xem chỉ cần mới xem qua hình ảnh biểu đồ (chưa cần xem số liệu cụ thể) là đã có thể thấy được
Overview 1:
Country 5 là nước có số liệu cao nhất trong tất cả các nhóm.
Overview 2:
Số lượng người sở hữu xe ô tô biến động một cách rõ ràng qua 10 năm.
Body Paragraph 1: Nêu số liệu và xu hướng của 3 nước đầu tiên (Countries 1,2,3)
Câu 1 – Body 1
Nêu số liệu năm đầu của Country 1.
Câu 2 – Body 1
Nêu xu hướng và số liệu năm cuối của Country 1.
Câu 3 – Body 1
Nêu số liệu trong 3 năm của Country 2.
Câu 4 – Body 1
Nêu xu hướng và số liệu của Country 3.
Body Paragraph 2: Nêu số liệu và xu hướng của 3 nhóm còn lại (Countries 4,5 và Average)
Câu 1 – Body 2
Nêu số liệu và xu hướng của Country 4.
Câu 2 – Body 2
Nêu số liệu và xu hướng của Country 5.
Câu 3 – Body 2
Nêu số liệu và xu hướng của nhóm Average.
Đề bài: The bar chart shows the number of cars per 1000 people in five European countries over the 3 years 2005, 2009, 2015, compared with the European average.
Bài làm